






If your blog responds slowly when readers open the menu, click search, submit a form, or open the table of contents, you should prioritize improving INP for your blog. INP reflects not only the time JavaScript takes to run, but also the delay before the handler starts, the time needed to update the interface, and when the browser paints the next frame.
This guide helps you quickly answer the question What is INP, measure real-world data with PageSpeed Insights, reproduce issues with Chrome DevTools Performance, and apply suitable fixes to WordPress blogs, Blogger sites, or websites using custom JavaScript.
What is INP, and what is considered a good score?
INP, short for Interaction to Next Paint, is a metric in the Core Web Vitals used to evaluate how responsively a page reacts to interactions such as mouse clicks, screen touches, and keyboard input. The metric observes eligible interactions throughout the visit and represents them using the slowest or nearly slowest interaction, rather than measuring only the first interaction as FID did previously (according to web.dev).
| INP | Rating | Practical meaning |
|---|---|---|
| ≤ 200 milliseconds | Good | The interface usually responds quickly and clearly. |
| Over 200 to 500 milliseconds | Needs improvement | Users may notice delays during some actions. |
| > 500 milliseconds | Poor | The page may easily feel frozen or unresponsive. |
The thresholds above are evaluated at the 75th percentile and should be separated between mobile and desktop devices. A blog with good INP on desktop may still be slow on low-end phones, especially when it loads many ads, sharing widgets, trackers, or JavaScript libraries.
The important point is that INP is not a page-load speed metric. PageSpeed Insights may display INP from real-user data if the URL or domain has sufficient data in the Chrome User Experience Report (CrUX). In contrast, Lighthouse laboratory tests usually use Total Blocking Time, or TBT, as a proxy because automated loading does not generate enough interactions to measure INP directly (according to web.dev).
Measure INP with PageSpeed Insights Before Making Changes
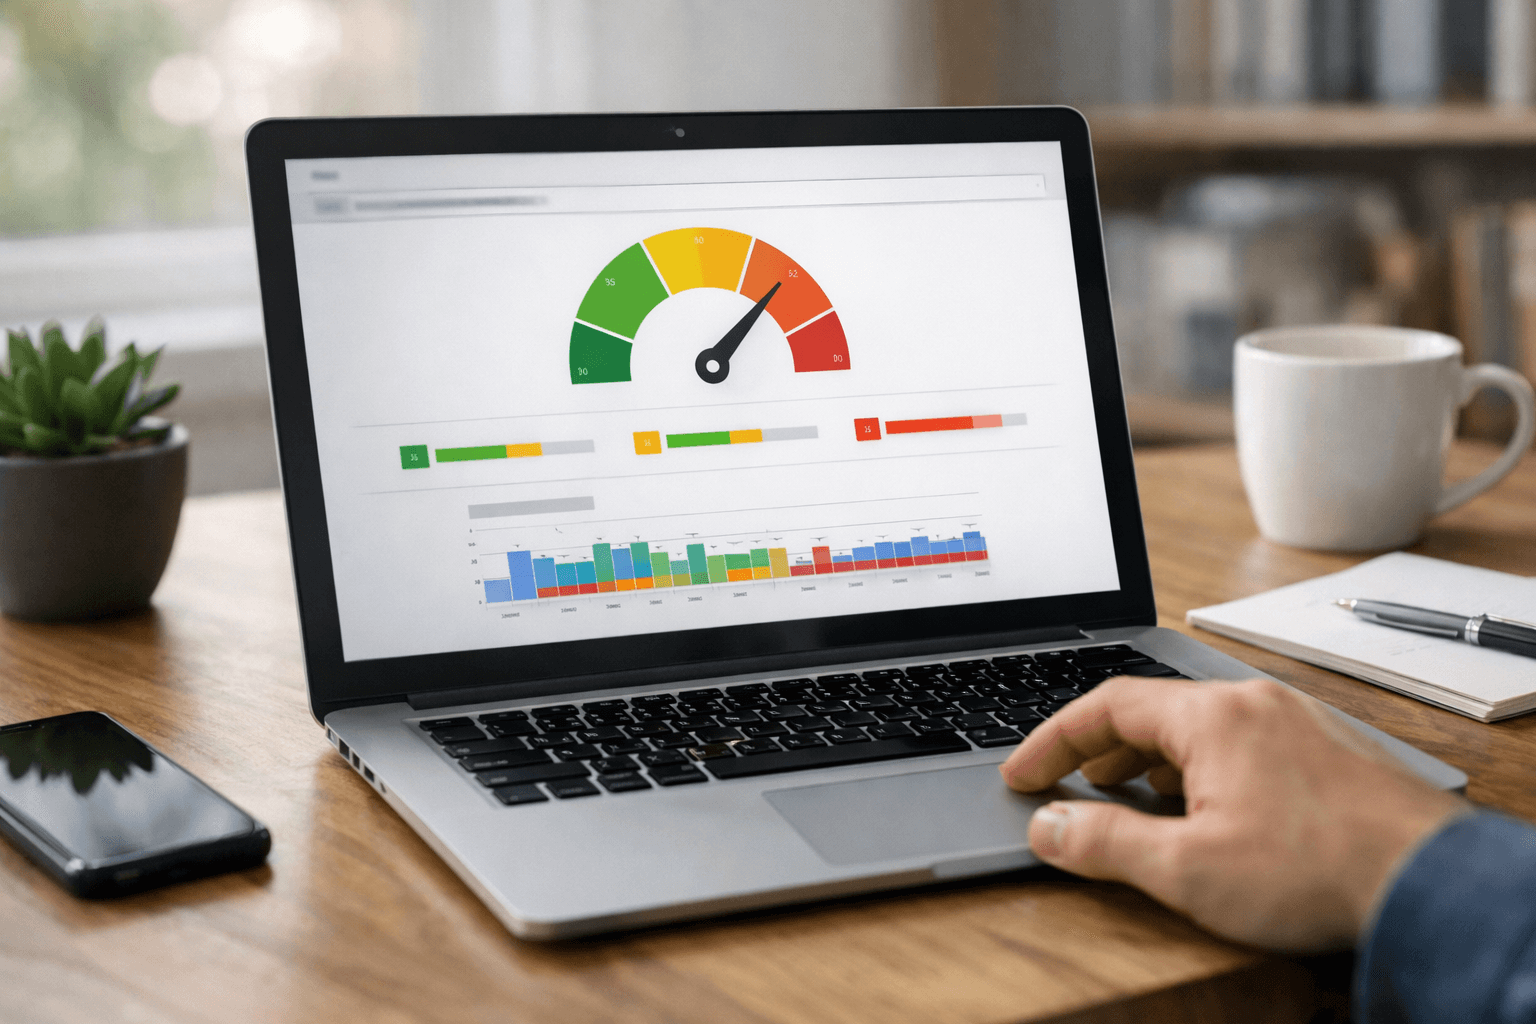
Step 1: Check real-user data
- Open PageSpeed Insights and enter the URL of the blog post or homepage.
- Select the mobile report first, because this group typically has more limited CPU and network resources.
- Find the real-world data section, usually labeled field data or real-user experience.
- Record the INP, rating status, and data scope: URL-level or origin-level.
If PageSpeed Insights does not show INP, that does not necessarily mean the page is perfect. The URL may not have enough eligible visits in CrUX, users may not have performed the relevant interactions, or the latest data may not yet have been aggregated. In that case, check multiple URLs using the same interface template and take additional measurements with Chrome DevTools or a RUM tool (according to web.dev).
Step 2: Use the diagnostics section to find relevant clues
In the laboratory results, pay attention to TBT, JavaScript execution time, long tasks on the main thread, unused JavaScript, and third-party code. These are not definitive causes of INP, but they are useful clues for narrowing down the issue. For example, high TBT often indicates that JavaScript is occupying the main thread for long periods, forcing user interactions to wait.
Do not try to achieve a score of 100 by fixing every warning. Prioritize issues associated with important interactions: opening the mobile menu, activating search, opening filters, switching tabs, submitting comments, or clicking the newsletter signup button.
If your blog relies on multiple analytics tools, consider collecting data responsibly through privacy-respecting first-party data. Reducing unnecessary tracking code often benefits both privacy and the amount of JavaScript work performed on the page.
Analyze and Fix INP with Chrome DevTools Performance
Step 1: Prepare a repeatable measurement
- Open the article you want to test in Chrome.
- Press F12 or select More tools → Developer tools.
- Open the Performance tab. Chrome now recommends using the Performance panel and Insights instead of the old Performance Insights panel, which was removed starting in Chrome 132 (according to developer.chrome.com).
- In Capture settings, enable CPU throttling at an appropriate level, such as a 4× slowdown to simulate a lower-end device.
- Disable the cache when you need to test the loading process, but when testing post-load interactions, keep the scenario consistent.
Step 2: Record the slow interaction
- Click Record.
- Perform exactly the interaction you want to test, such as opening the menu, closing it, and then opening search.
- Wait for the interface to respond, then stop recording.
- In the Live Metrics view, check the local INP after the interaction. Then use the recording to find the corresponding interaction in the Interactions section.
The Performance panel can display Core Web Vitals while you interact and lets you view a table of interactions, their durations, and the related processing (according to developer.chrome.com). When selecting a slow interaction, follow the Main track and the areas marked with red triangles. These are usually long tasks, meaning a segment of work occupies the main thread for too long and delays the response.
Step 3: Identify what is causing the slowdown
INP usually consists of three parts: the input delay before the event handler runs, the callback processing time, and the time the browser takes to finish rendering. The fix depends on which part takes the most time:
- High input delay: reduce the JavaScript that runs during page load, defer ad code or nonessential features, and remove unused plugins and libraries.
- Long processing time: shorten callbacks, avoid looping over too many elements, and split large tasks into smaller pieces. You can yield the main thread between pieces of work with
setTimeoutorscheduler.yield()when the environment supports it. - High presentation delay: reduce the number of DOM elements that need updating, avoid changing hundreds of elements after a single click, and do not generate a large amount of HTML with JavaScript in the same frame.
To see exactly which functions consume time, open Call tree or Bottom-up in the recording. Chrome DevTools lets you filter activities by duration and work type, and open a link to the corresponding source line when a source map is available (according to developer.chrome.com).
Step 4: Apply practical fixes to the blog
- Reduce third-party scripts: remove widgets you no longer use, defer social sharing code, and load the comment system only when readers scroll to that section.
- Split JavaScript by function: code for the contact page should not load on every post. In WordPress, check which plugins inject scripts site-wide and limit the scope of enqueueing.
- Reduce DOM updates: instead of rebuilding the entire post list when users click a filter, update only the results area and the button state.
- Avoid continuously reading and writing layout: batch element-size reads first, then make CSS or DOM changes to limit layout thrashing.
- Prioritize visual feedback: change the button state as soon as the interaction is received, show a loading state, and perform the heavy work afterward. Early feedback does not replace true optimization, but it helps users understand that their command has been received.
- Reduce off-screen DOM: for comments, related-post sections, or long blocks at the end of an article, consider loading them on demand and try
content-visibilityafter checking interface compatibility. This is a recommended approach for reducing unnecessary rendering work (according to web.dev).
If the blog has multiple language versions, check the language switcher scripts and navigation components as well. A process for managing non-duplicate hreflang translations helps reduce redundant content and logic, although it does not replace JavaScript optimization.
After each change, record the same scenario on a similar emulated device. Compare interaction duration, long tasks, and the Main track area. Then run PageSpeed Insights again after real-user data has had time to update; lab scores can vary depending on the network, server, and time of the run.
Do not check only the menu button. Make a list of the blog’s 5–10 most important interactions, including search, the table of contents, forms, comments, and load-more links. A change that makes the menu faster but slows down search or forms is not an overall improvement.
If your goal is to increase content distribution, interaction speed should go hand in hand with content structure and discoverability. You can also consult how to get a blog into Google Discover but you should not treat Discover as a reason to add more tracking scripts or heavy widgets.
In summary, the process for improving INP for a blog effectively consists of four steps: review real-user data in PageSpeed Insights, reproduce the slow interaction using Chrome DevTools Performance, identify where time is being wasted, and retest using the same scenario. Prioritize reducing unnecessary JavaScript, splitting long tasks, controlling DOM updates, and measuring on mobile devices. Good INP is the result of many small improvements that are continuously verified, not a single trick.
Reference source
- Lượt tương tác đến nội dung hiển thị tiếp theo (INP) | Articles | web.dev
- Optimize Interaction to Next Paint | web.dev
- Core Web Vitals workflows with Google tools | Articles | web.dev
- Performance panel: Analyze your website's performance | Chrome DevTools | Chrome for Developers
- Performance features reference | Chrome DevTools | Chrome for Developers
